Do you assess and inspect the quality of your pipeline as much as quantity?
Any self-respecting sales manager or executive knows that generating a pipeline is a careful balance between quantity and quality. However, sales teams often fall into the pattern of hitting their pipeline targets but missing the revenue objectives.
The reason for that is usually because they (knowingly or unknowingly) had certain expectations around funnel conversion rates that fell short.
While organizations can easily track whether or not they’re meeting their pipeline quantity numbers, most don’t or can’t effectively analyze funnel conversion rates. Without that, there’s no way of knowing whether or not a team is on track to meet or exceed the target – until it’s too late to do anything about it.
To know if you’re on track for conversion rate targets, you must analyze conversions at each stage of the funnel, not just wins/loss rates. However, you can’t do that with today’s CRMs.
What every manager needs is a proper monitoring system. One that not only lets them assess if they’re on track to hit the number of opportunities (quantity) but also pipeline quality. Measuring quantity and quality puts teams in a much better state to hit revenue expectations or implement countermeasures early to correct specific situations.
Using Throughput to Assess Your Pipeline Quality
If you haven’t read the article about Throughput, now is a great time to do that before proceeding.
With Ops-in-a-Box, you can easily compare the Throughput of newer opportunities to older ones and assess whether the conversion rate is on track – at any stage of the customer journey.

That means you can find out early if your opportunities are not converting through the sales stages at the same rate as a previous period – ideally, the period you used for planning conversion rate targets.
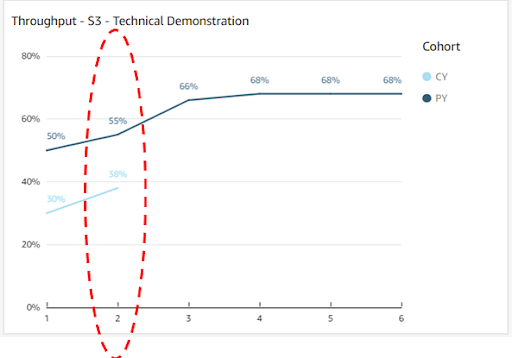
In the example below, we are comparing the Throughput at Stage 3 (Technical Demonstration) and have broken the opportunities into two categories or cohorts:
- PY (Previous Year) – These are the opportunities from last year that were used as the benchmark for our annual planning.
- CY (Current Year) – This represents the opportunities generated for the current fiscal year (we are only two months into the current year).

In the line graph above, you may have noticed that there’s a potential problem. Far fewer opportunities have converted to stage 3 than the previous year (17 percent less).
There are several possible reasons why that’s the case. The key to identifying what’s behind the problem is to ask the right questions, such as:
- Did the team focus too much on quantity and not enough on quality?
- Is the source or type of opportunities generated significantly different from the previous year? For example, last year comprised 50/50 sales/marketing; this year, it’s 70/30 sales/marketing-generated opportunities.
- Is it a personnel or staff issue?
You can determine what to do once the issue is identified, such as doing any of the following.
- Pump more effort towards generating opportunities. Whenever your conversion rate drops, a quick and easy solution is to generate more to offset the expected dip in conversion. Doing that may not be a long-term solution, but it might give you the time and space necessary to conduct a more thorough analysis – and develop a long-term plan of action.
- Change the mix. If you know that certain opportunities (specific industries, sources, or products) have higher conversion rates, then you can focus on generating more of those leads.
- Address personnel issues. You could identify individuals that are bringing down your conversion rate and then provide more enablement and training. That’s often the case with fast-growing companies.
As you can see, Throughput is a powerful feature that lets you assess and pinpoint pipeline quality issues. When quality and quantity are aligned, sales teams are more effective. You can install Ops-in-a-Box straight from the AppExchange today.
