

Are you the driver or a passenger when it comes to your sales forecast?
To be more specific, can you efficiently do the following?
- Use real data to drive the conversation in your forecasting calls.
- Help managers and reps identify weak spots in their pipeline and implement countermeasures before it is too late.
- Provide valuable data and feedback to managers and reps about how they can improve their forecasting accuracy.
- Identify individual deals that are constantly being pushed from your pipeline.
If you can’t do any of the above with ease – you know, without breaking a sweat – then you’re in good company. CRMs don’t provide all the tools necessary to derive meaningful insights and make accurate predictions. That’s why many sales leaders struggle to create realistic sales forecasts.
For better forecasting calls, you need the ability to go into the past and compare the state of opportunities between any two periods. And that’s where Ops-in-a-Box can help.
Forecasting Explained
Ops-in-a-Box uses daily snapshots of your opportunities to apply past performance to future periods.
The simplest way to grasp the concept is to look at an example.
Let’s assume that you’re trying to forecast sales revenue for June 2021.
The table below shows the starting pipelines and results for the last 12 months, taken from the snapshot database.
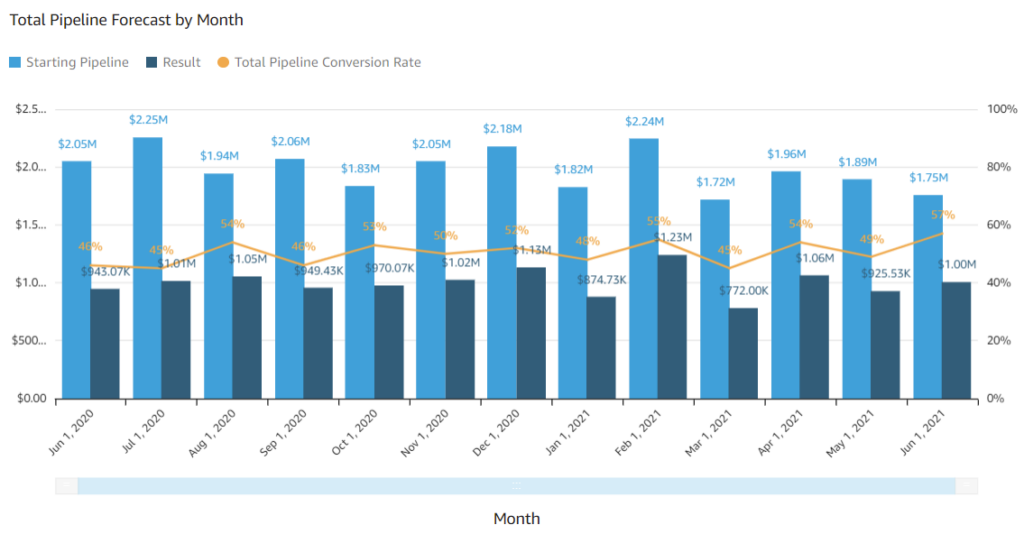
Analyzing the column charts, we can see that the average conversion rate is 50 percent for the starting pipeline. The minimum conversion rate is 45 percent, and the maximum is 55 percent.
If our starting Pipeline for June 2021 is $1.75M and we apply the average conversion rate from previous periods, we can assume $875K will close – 50 percent of $1.75M.
That’s leveling up your forecasting process – using daily snapshots of your data for the last 12 months (or any selected periods) to produce a more accurate sales forecast.
Whether you apply the min, max, average, or a custom percentage to the current period will depend on the quality of your pipeline, input from your managers and representatives.
Contributing to Forecasting Calls (Where Art Meets Science)
When applied correctly, you can leverage the forecast models in Ops-in-a-Box to constructively and effectively contribute to every forecasting call. Let’s take a look at an example.
Scenario: Jerry is predicting that his team will close $1M in sales for June 2021. While it’s a stretch for Jerry, the goal isn’t out of reach. However, you want to ensure his call is sound.
In that case, you can use Ops-in-a-Box to make sure Jerry analyzed his pipeline properly and is calling the correct forecast.
In the column chart below, you can see that Jerry’s team has an average conversion rate of 50 percent against the starting pipeline. The minimum conversion is 45 percent, and the max is 55 percent.

If we assume that Jerry will close at the average conversion rate of 50 percent, then at least $2M must be in the team’s pipeline to close $1M. So the current amount in the pipeline ($1.7M) would have to increase to $2M. Otherwise, the team will most likely win half of $1.7M ($850K).
Even if we were to apply Jerry’s best monthly conversion rate of 55 percent, his team would still end up short – at $963K shy of Jerry’s $1M call.
But what if you spoke to Jerry about the numbers, and he still wants to stick with $1M because he believes the current pipeline is the best his team has ever had.
In that case, you can verify the quality of his pipeline with Ops-in-a-Box to make sure that is an accurate assumption.
Ops-in-a-Box lets you compare the current month’s starting pipeline by stage with any previous period. With Jerry’s team, we can see that they have a higher percentage of late-stage deals in June compared to other months.

That’s a good sign because late-stage deals are more progressed and, therefore, have a higher likelihood of closing. So Jerry’s call of $1M sounds reasonable. If the team doubles down on efforts, they’ll have a good chance at reaching the forecast.
At this point, management may prefer that Jerry calls at the team’s max conversion rate instead of above it. Using the max conversion is safe, but a higher target might fire up the team in a good way. Management will need to weigh all the pros and cons.
Comparing stages at the start of the month is only one way to assess quality. With Ops-in-a-Box , you can also look at the average age of the pipeline, the forecast category, lead source, industry, average sales price – and practically any other data point in your CRM.
There’s no problem with human subjectivity in forecasting, but the best outcome occurs when you have the correct data. Ops-in-a-Box will help you take immediate and specific action on weak spots in the pipeline before it’s too late. Ops-in-a-Box is now available on the AppExchange – install it today.